Table of Contents
– Why Your Pipeline Toil Problem Isn’t a Stack Problem
– The Three Layers of Data Pipeline Automation
– How to Sequence the Rollout Without Disrupting Production
– What to Look for in Tooling and Partner Evaluation
– What Success Looks Like — Operational Outcomes to Measure
TL;DR
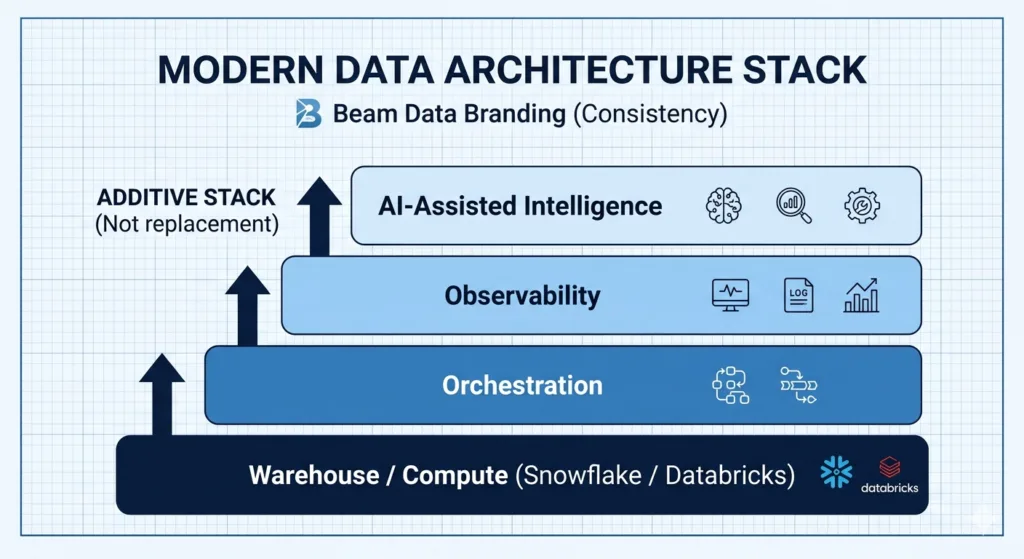
– Data pipeline automation means adding orchestration, observability, and AI layers *on top of* your existing stack — not replacing it.
– Teams on Snowflake or Databricks can introduce these layers incrementally without migrating, re-engineering existing pipelines, or taking production offline.
– Start with observability first: it’s read-only, zero-risk, and delivers visible wins fast. Add orchestration improvements second, AI-assisted features last.
– Add AI-assisted detection and diagnosis now — fully autonomous remediation is production-ready only for well-scoped, repeatable failure patterns.
– Vendor-agnostic evaluation criteria matter: stack compatibility, incremental adoption, and observability depth separate the useful tools from the lock-in disguised as a solution.
Why Your Pipeline Toil Problem Isn’t a Stack Problem
If you’re running production pipelines on Snowflake or Databricks, you’ve probably been in this situation: engineers are spending 30–40% of their time responding to failures rather than building new capabilities. The on-call burden is compounding as pipeline complexity grows. Downstream stakeholders are complaining about data quality issues they discovered before your team did.
The vendor pitch for this problem is predictable. Migrate to their platform and the operational complexity goes away. The new system handles scheduling, monitoring, and failure recovery natively. You just have to re-engineer your existing pipelines and move your data.
The pitch is appealing because it frames automation as a property of the platform rather than a layer you build. That framing is wrong in a specific way: it costs organizations six-month migration projects and real engineering capacity to solve a problem that could be addressed incrementally.
Here’s what practitioners who operate mature stacks actually know: most production pipeline failures don’t come from bad logic. They come from data drift and schema changes — the external inputs behaving differently than the pipeline expected. A post in the r/ETL community put it plainly in a thread on self-healing pipelines: “most production pipelines fail not from bad logic but from data drift and schema changes.” A migration to a new platform doesn’t eliminate that failure mode. It just moves it to a different environment while you’re also dealing with migration risk.
The correct frame is this: automation is an orchestration and monitoring layer that sits *above* your warehouse, not inside it. You don’t need a new warehouse to add retry logic, dependency-aware scheduling, or anomaly detection. You need a different layer of tooling on top of what you already have.
Here is the short answer:
Automating data pipeline operations on an existing stack means adding three layers — orchestration, observability, and AI-assisted intelligence — on top of your current warehouse and compute infrastructure, not inside it. Teams on Snowflake or Databricks can introduce these layers incrementally — orchestration first, then observability, then AI-assisted intelligence — without migrating their warehouse or re-engineering existing pipelines. None of these steps require touching your warehouse schema or existing pipeline code. The result is reduced operational toil, faster time-to-detection for pipeline failures, and engineering time freed for net-new work.
The Three Layers of Data Pipeline Automation
The mental model here is straightforward: three layers, each additive, each operating above your storage and compute layer. None of them require your warehouse to change. Each one delivers independent value — so you can justify each layer on its own ROI without committing to the full program upfront.
Layer 1 — Orchestration (Dependency Management and Retry Logic)
Orchestration is the coordination layer. It controls when, how, and in what sequence each step of your pipeline runs — separate from where the data lives and how it’s processed. As Snowflake describes it, data orchestration is the coordination and management layer that sits above the warehouse, responsible for scheduling, dependency resolution, and execution tracking.
What orchestration adds to an existing stack is specific and valuable: dependency-aware scheduling (step B only runs after step A succeeds), automated retry logic for transient failures, failure routing, and alerting — all without touching your warehouse schema or existing pipeline code. The orchestration layer doesn’t reprocess your data. It manages the sequence of operations against your existing infrastructure.
The leading tools in this category — Apache Airflow, Dagster, and Prefect — are designed to sit alongside Snowflake, dbt, and Databricks rather than replace them. Dagster, for example, provides native integrations with Snowflake, dbt, and Databricks that allow it to schedule and monitor jobs within those environments without requiring any data migration or pipeline rewrite. As dbt Labs has documented, orchestration tooling is the foundation of pipeline automation: it’s the layer that allows teams to codify execution order, enforce dependencies, and automate failure response systematically rather than reactively.
If your team is currently running basic cron jobs or a home-built scheduler, adding Airflow or Dagster is the single highest-leverage improvement available. If you’re already on Airflow, the highest-leverage work is often in the DAG definitions themselves — dependency relationships, retry logic, and failure routing — rather than in the tool itself.
Layer 2 — Observability (Monitoring, Alerting, Anomaly Detection)
Observability is the monitoring layer. Not “did the job run” monitoring — that is table stakes. Data observability in the operational sense means automated data pipeline monitoring of freshness, volume, schema, distribution, and lineage. The question it answers is not whether the job completed, but whether valid data arrived.
The operational shift this enables is significant: from reactive (an analyst notices a dashboard is wrong, files a ticket, and your engineer traces the issue backward through several pipeline stages) to proactive (the observability layer detects the anomaly at ingestion, before it propagates downstream). Acceldata’s research on data operations teams documents alert fatigue as one of the primary pain points in mature data environments — engineers spending hours triaging noise rather than responding to genuine failures. The move to proactive detection directly addresses that problem.
Observability tools in this space — Monte Carlo, Acceldata, Pantomath — integrate with Snowflake and Databricks via APIs. They don’t sit inside your warehouse — they watch it from the outside, querying metadata and statistics to surface anomalies. Pantomath’s DataOps maturity framework frames this transition well: teams progress from basic job monitoring to data quality monitoring, and from there to automated remediation. The observability layer is the inflection point in that progression.
The most common mistake at this stage is treating observability as equivalent to job monitoring. Job status tells you a process completed. Observability tells you whether the output is trustworthy. Those are different questions with different operational consequences.
Layer 3 — AI-Assisted Intelligence (Diagnosis and Self-Healing)
This is where agentic AI enters the picture — and where it’s important to be precise about what’s production-ready and what isn’t.
A self-healing pipeline is one that can detect its own failures, diagnose the cause, and trigger corrective action without manual intervention. The technical architecture behind this, as documented by practitioners building these systems, involves three components: automated monitoring that detects anomalies or failures, root cause analysis logic that traces which upstream dependency caused the issue, and automated remediation that either reruns failed tasks, applies schema patches, or routes around a failed source.
AI-assisted anomaly detection and root cause analysis are production-ready on complex stacks today. If you have a multi-source environment with dozens of upstream dependencies, an AI system that can trace a data quality anomaly to its root cause in seconds rather than requiring an engineer to work backward through dependency graphs is genuinely valuable and deployable.
Fully autonomous remediation — where an agent makes and executes a fix without human approval — is more limited. It works well for defined, well-scoped failure modes: schema drift on a source that follows predictable patterns, transient failures on known flaky sources, retry logic for known timeout conditions. For novel failure patterns, human-in-the-loop remains the right design. As Acceldata’s work on agentic data systems documents, the practical architecture combines deep observability (detect) with AI-assisted diagnosis (understand) and conditional automated remediation (act) — with the “act” component scoped to failure patterns the system has been trained on.
Ascend.io’s agentic data engineering platform is a concrete example of this architecture in practice: AI pipeline building, automated testing, and self-healing workflow features that operate as a layer above existing infrastructure.
The Databricks blog’s framing of AI-assisted ETL is also useful here — AI tools connect via APIs to existing infrastructure rather than replacing it, enhancing what the pipeline already does.
The honest summary: add this layer third, after the observability foundation is stable. Agentic remediation without good observability data produces garbage. Get the detection right before you build the response.
How to Sequence the Rollout Without Disrupting Production
The sequencing principle is simple: start with the layer that has the lowest blast radius if something goes wrong.
Observability is read-only. It watches your stack — it cannot break it. That’s where you start.
Step 1 — Observability first. Instrument data freshness, volume anomaly detection, and schema change alerting on your highest-priority pipelines. No changes to existing pipeline code are required. The tooling connects to Snowflake or Databricks via APIs and begins building a baseline of normal behavior. Time to first value is days to weeks, not months. The first deliverable is a reduction in downstream complaints — stakeholders start seeing data quality issues caught before they hit dashboards. That visibility builds internal credibility for the work ahead.
Step 2 — Orchestration improvements second. Once you can see failures clearly, introduce or improve the orchestration layer. If you’re running cron-based scheduling, migrate to Airflow, Dagster, or Prefect. If you’re already on Airflow, the priority is DAG improvement: dependency relationships, retry logic hardening, and failure notification routing. This step has more blast radius than observability — you’re changing how jobs are scheduled and executed — which is why you want the observability layer in place first. If an orchestration change causes a problem, you’ll see it immediately rather than discovering it three hours later from a downstream analyst. Timeline: weeks to 1–2 months for a focused rollout on the highest-priority pipelines.
Step 3 — AI and agentic features third. Layer in AI-assisted diagnosis and, where failure modes are well-defined, automated remediation. The risk of getting this wrong isn’t that the AI breaks your pipelines — it’s that you invest in automation for failure patterns that are either too rare to justify the overhead or too novel for the system to handle reliably. Scoping that correctly requires judgment that comes from prior implementations. This is the most complex step and the one that benefits most from an external partner who has run this before. Timeline: 1–3 months depending on stack complexity and the scope of failure patterns targeted.
There’s also an organizational dimension to sequencing that’s worth naming. Observability deliverables are visible to stakeholders outside engineering — fewer downstream data quality complaints, faster response times when issues do occur. A VP of Data who can show their CTO a measurable reduction in data downtime after the first phase has a quantified ROI argument for the orchestration and AI work ahead — not a hypothesis. That early win sustains the investment through the more complex phases.
For teams who want to see how this sequencing plays out in practice on a production data pipeline, the real-time data pipeline Beam Data built for a fintech recommender system shows how automated monitoring and orchestration improvements were layered onto an existing stack to support real-time data requirements in a regulated environment. Beam Data also ran this sequencing for a marketplace forecasting client, where automating the pipeline’s orchestration layer directly reduced manual intervention in the forecasting workflow.
What to Look for in Tooling and Partner Evaluation
When you’re evaluating tooling or an external partner to help execute this, the criteria that matter most are the ones that prevent you from trading one set of dependencies for another.
– Stack compatibility. Does the tool integrate with your existing warehouse and transformation layer via native connectors or open APIs? Tools that require proprietary data formats or custom adapters introduce migration risk in disguise.
– Incremental adoption. Can you instrument one pipeline and expand gradually, or does the tool require a full-stack rollout before delivering value? This matters because it de-risks the evaluation and keeps your engineers focused on production rather than a six-month implementation project.
– Observability depth. Does the tool track freshness, volume, schema, and lineage — or just job status? Job-status monitoring is table stakes. Data-quality observability is where the operational value lives. If a vendor can’t clearly explain how they detect anomalies in data content (not just job completion), that’s a signal.
– Vendor lock-in signals. Does the vendor require proprietary pipeline definition formats? Does the pricing model penalize you for reducing usage? Can you export your pipeline definitions and observability rules if you switch? These questions are worth asking explicitly during a vendor evaluation.
– For external partners. The criteria that matter most are vendor-agnostic positioning (not affiliated with or incentivized by a specific platform), demonstrated ability to work within existing stacks, and a co-build engagement model that builds your team’s capability rather than creating ongoing dependency. If a partner works primarily within one cloud ecosystem or has a referral arrangement with a specific observability platform, their recommendation will reflect that relationship — not your stack.
The Databricks blog’s framing is useful here: AI tools and automation layers should connect via APIs to existing infrastructure, not require you to move inside them.
Beam Data’s data platform modernization work is specifically designed around the stack-preserving model — working with existing Snowflake and Databricks environments rather than recommending migration as the path to operational improvement. That positioning matters in this evaluation because it changes the incentive structure of the engagement. For teams evaluating AI infrastructure design that works with your existing stack, our approach is the same: build on what you have, extend it where you need capability, and leave your team owning the result.
What Success Looks Like — Operational Outcomes to Measure
The business case for data pipeline automation doesn’t live in the language of “AI” or “automation.” It lives in operational metrics that your CTO and CFO can evaluate directly.
The primary operational outcomes to track:
– Mean time to detection (MTTD) for pipeline failures — how long between a failure occurring and your team knowing about it
– Engineer hours on reactive maintenance versus net-new work — the allocation ratio that determines whether your team is building or firefighting
– On-call incidents per quarter — the volume of escalations that pull engineers out of planned work
These three metrics capture the value of the orchestration and observability layers directly.
The business translation of those metrics matters for the internal conversation. Engineering time freed from maintenance is capacity for net-new work — new use cases, new data products, new capabilities that directly serve the business. Fewer downstream data quality issues means fewer analyst hours chasing data errors that should have been caught at ingestion. Faster failure detection means shorter data downtime for business stakeholders. This has a direct cost in analyst productivity and decision latency.
For a VP of Data making the case internally, the framing that resonates with a CFO or CTO isn’t “we implemented a self-healing agentic pipeline.” It’s “we reduced our data downtime by X hours per month, freed up Y engineer-hours per week for product work, and reduced escalations from the analytics team by Z percent.” Those are the numbers that justify the investment and sustain it through the organizational change required to make it stick.
Beam Data’s initial consultation for pipeline automation projects focuses on exactly this: your existing stack, where the highest-concentration toil is, and where automation would deliver the fastest operational return — without a migration required. If you’re evaluating where to start, or weighing whether to run this internally or bring in outside expertise, book a conversation with our team.
Frequently Asked Questions
1.Can I automate data pipeline operations without migrating off Snowflake or Databricks?
Yes. Automation is an orchestration and observability layer that sits above your warehouse. It does not require migrating your data or re-engineering existing pipelines. Tools like Airflow, Dagster, Monte Carlo, and Acceldata integrate with Snowflake and Databricks via native APIs, leaving your existing stack untouched. The common vendor narrative that operational improvement requires a platform migration is wrong for teams with mature, functioning production infrastructure.
2. What is a self-healing data pipeline?
A self-healing data pipeline automatically detects failures, diagnoses the root cause, and triggers corrective action without manual intervention. In practice, this means a combination of observability tooling (detect anomalies before they propagate), AI-assisted root cause analysis (trace the issue to an upstream dependency), and automated remediation for well-scoped failure patterns such as schema drift or transient timeouts. For novel or complex failure modes, human-in-the-loop remains the right design.
3. Where should I start with data pipeline automation — orchestration or observability?
Start with observability. Observability tooling is read-only. It watches your pipeline without touching it — so there is no blast radius if setup is imperfect. It also delivers fast, visible wins: stakeholders see fewer downstream data quality complaints within days or weeks. Once you can see failures clearly, add or improve the orchestration layer with dependency-aware scheduling and retry logic. Add AI-assisted features last, once the observability foundation is stable.
4. Is agentic AI for data pipelines production-ready?
Partially. AI-assisted anomaly detection and root cause analysis are production-ready on complex stacks today. Fully autonomous remediation — where an AI agent makes and executes a fix without human approval — is production-ready only for well-defined, repeatable failure patterns (schema drift, transient timeouts). For novel or complex failure modes, human-in-the-loop remains the appropriate design. Add agentic features after the observability foundation is stable, not before.
The implementation path for data pipeline automation isn’t a migration. It’s three layers added incrementally, sequenced by risk, each one delivering measurable value before the next begins. The orchestration layer gets your pipelines running reliably. The observability layer makes failures visible before they propagate. The AI layer closes the loop from detection to diagnosis to remediation.
The teams that execute this well are the ones who resist the vendor pressure to make it bigger than it needs to be. Start with observability. Build from there.
If you want to talk through what that looks like on your specific stack, schedule time with Beam Data’s team. No migration required.